I have been using Distributed tracing in Spring Boot applications with Spring Sleuth & Zipkin. However, this time wanted to use OpenSearch as a back end for Tracing. Here are my learnings…
What is OpenSearch Trace Analytics
OpenSearch is a community-driven, opensource search and analytics suite derived from Apache 2.0 licensed Elasticsearch 7.10.2 & Kibana 7.10.2.
OpenSearch Dashboards is a UI component (derived from Kibana).
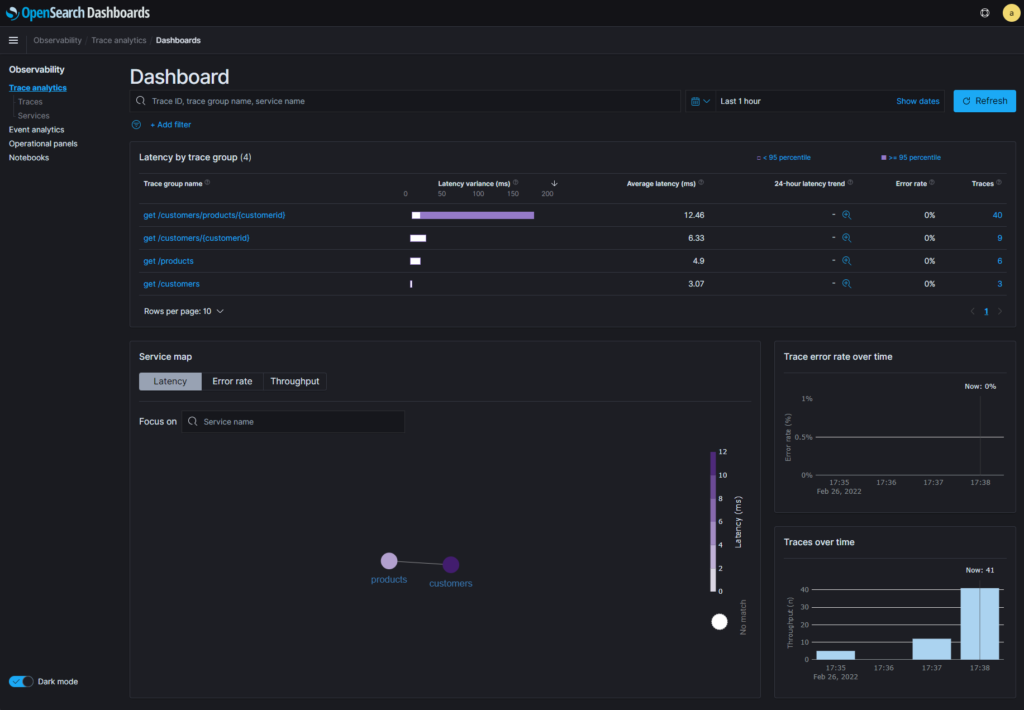
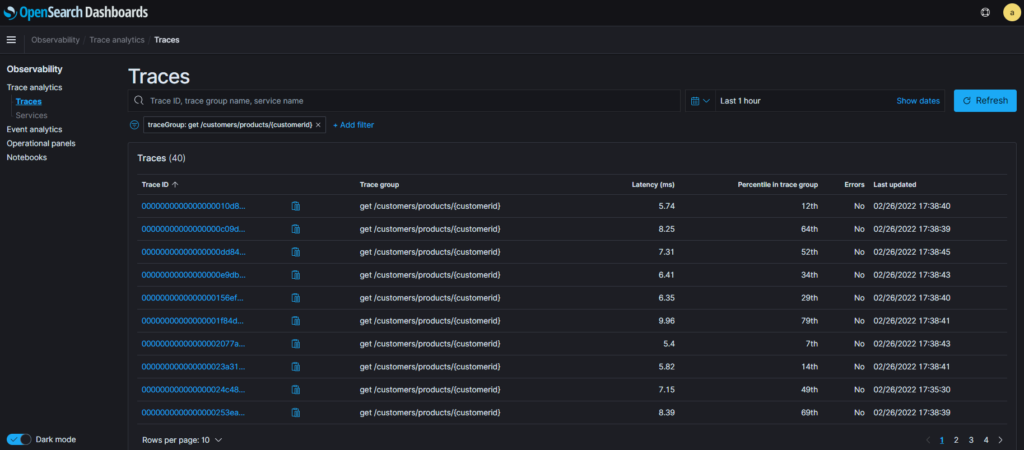
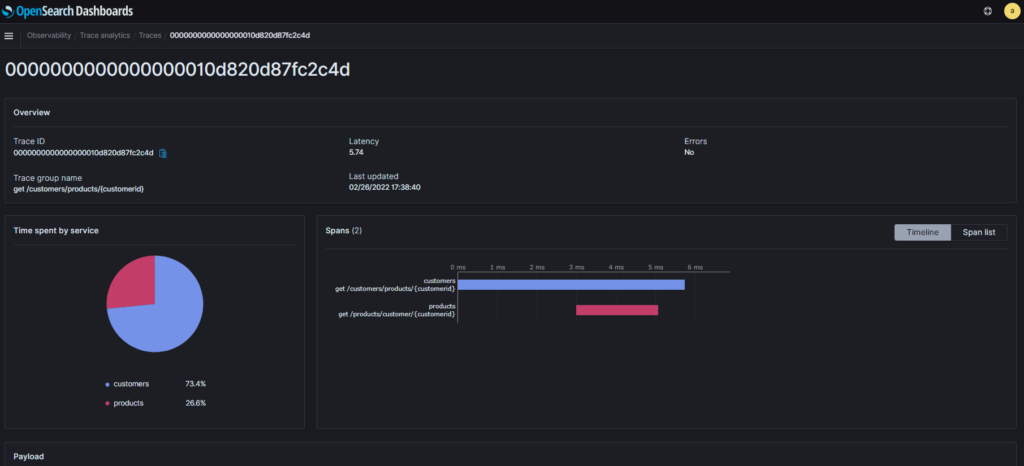
Trace Analytics – This feature is part of the Observability plugin in OpenSearch Dashbarods. This can help you visualize the flow of events and identify performance problems. This will help you visualize OpenTelemetry data.
AWS provides Managed “Amazon OpenSearch Service“.
OpenTelemetry
OpenTelemetry is a set of APIs, SDKs, tooling and integrations that are designed for the creation and management of telemetry data such as traces, metrics, and logs. The project provides a vendor-agnostic implementation that can be configured to send telemetry data to the backend(s) of your choice.
These are a couple of ways for instrumenting applications and sending traces to OpenSearch.
Before diving into the scenarios, let’s see a few components that we will encounter in the setup.
Data Prepper
Data Prepper is a component that can be used to convert the data for use with OpenSearch. It is a server-side data collector capable of filtering, enriching, transforming, normalizing, and aggregating data for downstream analytics and visualization.
OpenTelemetry Collector
The OpenTelemetry Collector is part of the OpenTelemetry project. It offers a vendor-agnostic implementation of how to receive, process and export telemetry data. It removes the need to run, operate, and maintain multiple agents/collectors. This works with improved scalability and supports open-source observability data formats (e.g. Jaeger, Prometheus, Fluent Bit, etc.) sending to one or more open-source or commercial back-ends. The local Collector agent is the default location to which instrumentation libraries export their telemetry data.
Brief about the sample application
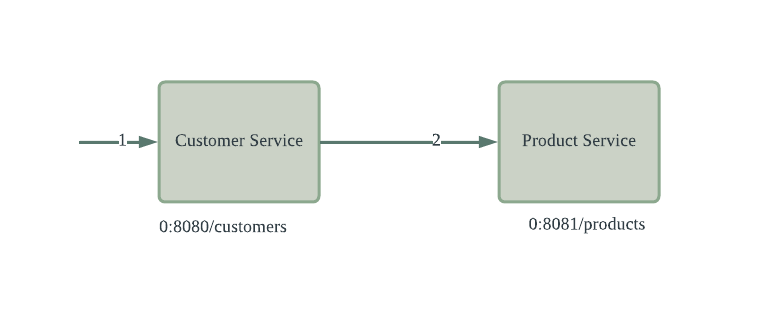
This application has 2 services with apis returning some static content. Would like to have traces with multiple spans across 2 different services.

Source
You can download the source code from git repo. It has 2 branches covering the scenarios described below.
Let’s look at the scenarios
Scenario #1: Spring Sleuth Zipkin
We will enable applications to use Spring Sleuth Zipkin to instrument code and this can send the traces to Zipkin backend or OpenTelemetry collector with Zipkin receiver.
In this case, we are going to use the 2nd option, which is OpenTelemetry collector with Zipkin receiver.

Add below dependencies in your application pom.xml. Refer pom.xml
...
    <properties>
		...
        <spring-cloud.version>2021.0.1</spring-cloud.version>
    </properties>

    <dependencies>
		...
        <dependency>
            <groupId>org.springframework.cloud</groupId>
            <artifactId>spring-cloud-sleuth-zipkin</artifactId>
        </dependency>

        <!-- Sleuth with OpenTelemetry tracer implementation -->
        <dependency>
            <groupId>org.springframework.cloud</groupId>
            <artifactId>spring-cloud-starter-sleuth</artifactId>
        </dependency>
	...
	</dependencies>
    <dependencyManagement>
        <dependencies>
            <dependency>
                <groupId>org.springframework.cloud</groupId>
                <artifactId>spring-cloud-dependencies</artifactId>
                <version>${spring-cloud.version}</version>
                <type>pom</type>
                <scope>import</scope>
            </dependency>
        </dependencies>
    </dependencyManagement>
In application.yaml add below configuration properties to enable otlp exporter, the endpoint refers to the otel-collector component. In the sample project, we will add this in both Customers and Proucts services.
...
spring:
  sleuth:
    otel:
      exporter:
        otlp:
          endpoint: "http://localhost:9411"
Look at the docker-compose.yaml, run docker-compose up to start data-prepper, opensearch, OpenSearch dashboards components and along with that, we will add otel-collector component as well, which will listen on port 9411 and receive traces from the application via http (Zipkin api).
You may run sample apis to generate the traces.


Scenario #2: Spring Sleuth OTel
In this scenario, we are going to use Spring Sleuth OTel, which implements Opentelemetry Tracer SDK. Refer to the documentation for more details on Spring Sleuth OTel.

With the Spring Sleuth OTel, the application can directly send traces in opentelemetry protocol (otlp) to data-prepper eliminating the need of another extra layer of otel-collector.
Add below dependencies to your application. Refer pom.xml
<project ...>
...
  <properties>
  ...
    	<spring-cloud.version>2021.0.1</spring-cloud.version>
        <spring-cloud-sleuth-otel.version>1.1.0-M4</spring-cloud-sleuth-otel.version>
    </properties>

    <dependencies>
...
        <!-- Sleuth with OpenTelemetry tracer implementation -->
        <dependency>
            <groupId>org.springframework.cloud</groupId>
            <artifactId>spring-cloud-starter-sleuth</artifactId>
          	<!-- Exclude brave implementation -->
            <exclusions>
                <exclusion>
                    <groupId>org.springframework.cloud</groupId>
                    <artifactId>spring-cloud-sleuth-brave</artifactId>
                </exclusion>
            </exclusions>
        </dependency>
        <!-- This dependency adds OTel support -->
        <dependency>
            <groupId>org.springframework.cloud</groupId>
            <artifactId>spring-cloud-sleuth-otel-autoconfigure</artifactId>
        </dependency>
        <dependency>
            <groupId>io.opentelemetry</groupId>
            <artifactId>opentelemetry-exporter-otlp-trace</artifactId>
        </dependency>
...
    </dependencies>
    <dependencyManagement>
        <dependencies>
            <dependency>
                <groupId>org.springframework.cloud</groupId>
                <artifactId>spring-cloud-dependencies</artifactId>
                <version>${spring-cloud.version}</version>
                <type>pom</type>
                <scope>import</scope>
            </dependency>
            <dependency>
                <groupId>org.springframework.cloud</groupId>
                <artifactId>spring-cloud-sleuth-otel-dependencies</artifactId>
                <!-- Provide the version of the Spring Cloud Sleuth OpenTelemetry project -->
                <version>${spring-cloud-sleuth-otel.version}</version>
                <scope>import</scope>
                <type>pom</type>
            </dependency>
        </dependencies>
    </dependencyManagement>

    <!-- You 'll need those to add OTel support -->
    <repositories>
        <repository>
            <id>spring-snapshots</id>
            <url>https://repo.spring.io/snapshot</url>
            <snapshots><enabled>true</enabled></snapshots>
        </repository>
        <repository>
            <id>spring-milestones</id>
            <url>https://repo.spring.io/milestone</url>
        </repository>
    </repositories>
    <pluginRepositories>
        <pluginRepository>
            <id>spring-snapshots</id>
            <url>https://repo.spring.io/snapshot</url>
        </pluginRepository>
        <pluginRepository>
            <id>spring-milestones</id>
            <url>https://repo.spring.io/milestone</url>
        </pluginRepository>
    </pluginRepositories>
</project>
Add below properties in application.yaml.
spring:
...
  zipkin:
    enabled: false
  sleuth:
    otel:
      exporter:
        otlp:
          endpoint: "http://localhost:21890" #this is data-prepper endpoint
Run docker-compose up to start the data-prepper, OpenSearch, and dashboard.
You may run sample apis to generate the traces.


Generating traces
You may use the below sample apis to generate some traces, you will have to send multiple requests in order to get the traces pushed to trace analytics. The default sampling rate is 1 per every 10 requests. Check the trace-id-ratio-based property in application.yaml
- http://localhost:8080/customers
- http://localhost:8080/customers/B001
- http://localhost:8080/customers/products/560
- http://localhost:8081/products
- http://localhost:8081/products/customer/XYZ123
If you would like to review the data-prepper config & pipeline or otel-collector config, refer to the data-prepper directory in repository.
References
- https://opensearch.org/docs/latest/clients/data-prepper/index/
- https://opentelemetry.io/docs/collector/
- https://opentelemetry.io/docs/concepts/what-is-opentelemetry/
- https://opensearch.org/docs/latest/observability-plugin/trace/index/
- https://opensearch.org/
- https://spring-projects-experimental.github.io/spring-cloud-sleuth-otel/docs/current/reference/html/project-features.html#features-otel

